Please fill out the details below to receive information on Blue Wealth Events
"*" indicates required fields


If I had a gun to my head and were forced to pick the top performer for the remainder of this cycle, I’d probably go with Perth. When I began researching the market around 2022, it was the biggest no-brainer I had seen in my 20 years in property. It was the Goldilocks situation of highest yields, fastest population growth (current and forecast), highest growth, lowest vacancies, fastest accelerating rents, affordable entry points, and positively geared…. And with the deepest technical undervaluation I had ever seen in my life. This is even before we consider the potential supercharger of the secular global push towards zero emissions and the projected lithium demand into the future. But truth be known, just about any major capital city will do well this cycle.
It has proven to be the fastest horse in the race since then. Perth continues to accelerate, unlike other markets that have hit temporary speed bumps due to the credit environment. However, this brings problems, as stock is hard to come by and sells quickly, and local demand is also high.
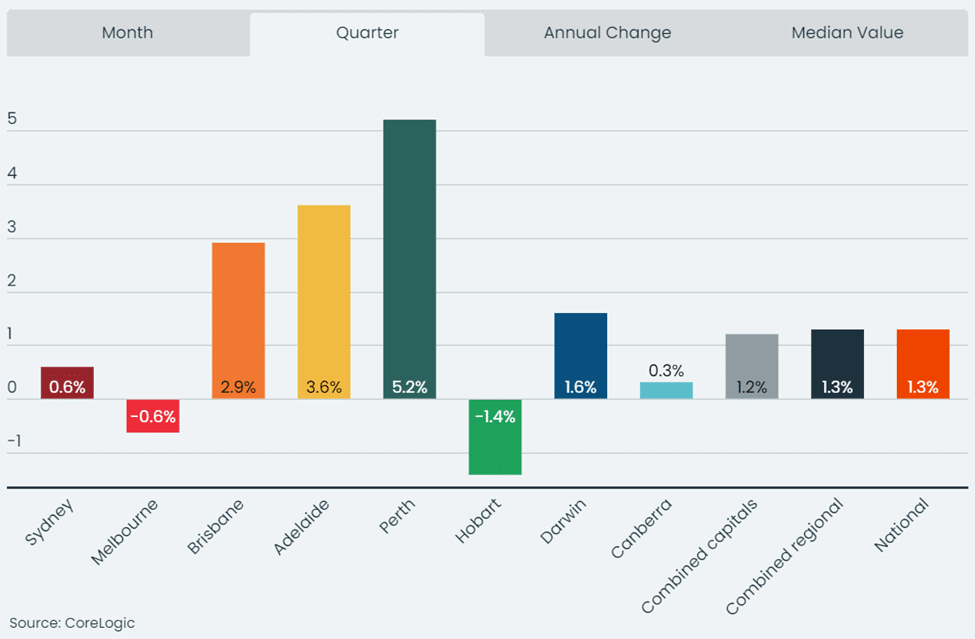
If we have a quick look at the housing market around the country, it’s clear that last year’s momentum has run into a wall of resistance in the form of credit and serviceability issues, with the two biggest markets slowing down. Yet three markets are still carrying the momentum from last year into this year, and Perth continues to lead the way.
The next question, of course, is, ‘Are we too late?’
This question seems to stump both novices and experienced investors alike. It probably boils down to personality types as measured by the Meyers-Briggs Type Indicator (MBTI)**.
To save you from further reading, the short answer is no, we’re not too late to enter the market.
But let’s have a look at this in more detail. First, nearly all the factors that pointed to Perth being the best market 18-24 months ago are still present. It still has:
But it no longer has positive cash flow because prices have moved quickly.
To understand where we are in the market, we have to understand where Perth sits in the context of the national market. In this case, we will use Sydney as a proxy because it’s the best representation of the markets that aren’t Perth or Darwin.
If we compare Sydney and Perth from up to 2000, we would see that the pattern is almost identical. In other words, they tracked each other perfectly (like much of the rest of the country at the time).
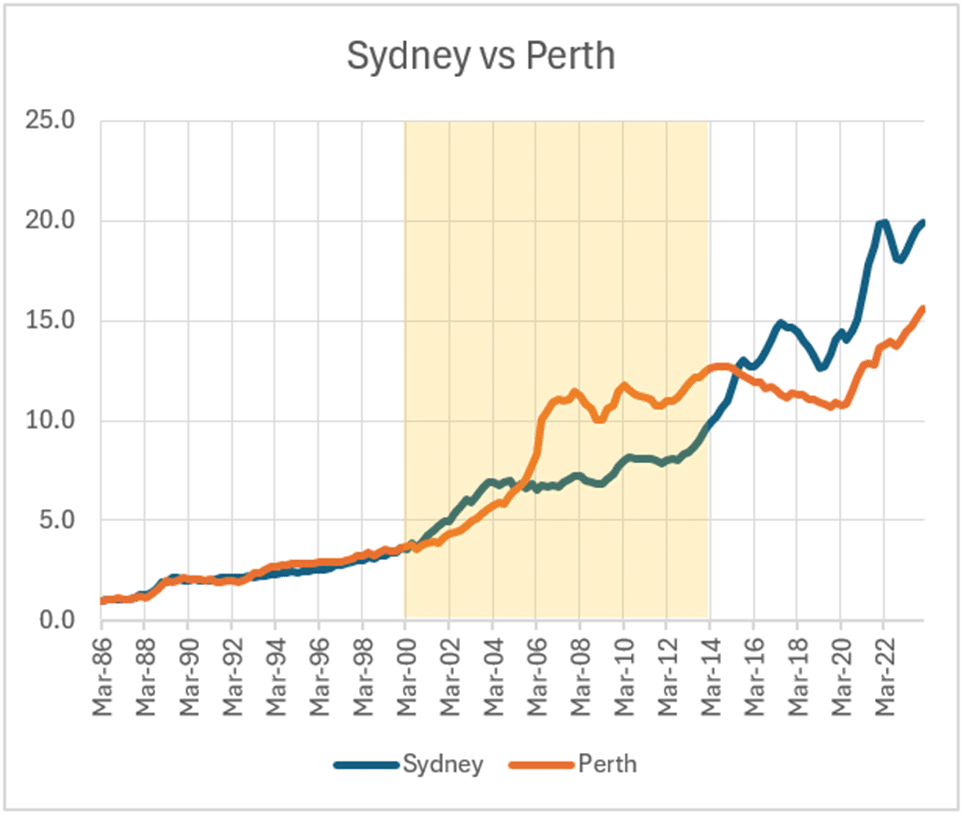
Then came the global commodities supercycle from 2000 to 2014. China began building a city the size of Brisbane every month. Steel intensity was high, and Western Australia has the highest grade of iron ore in the world, with one of the cheapest extraction costs. This enormous flow of capital found its way back into Perth land prices. Instead of the housing market topping out in 2003 like the rest of the country, it was thrown out of its normal cycle and continued to push up in 2014, where it peaked as the commodities cycle peaked. Over this period, the Perth housing market averaged 8.6% per annum (nearly a full percentage higher than Sydney, equating to hundreds of thousands of dollars more).
When they fell, they continued to fall for six years until all the froth was washed out, the excess housing supply dried out, and the technical indicators were reset. It was a perfect scenario to begin a new bull run. Yet, if we take another look at the graph above, it looks as though Sydney outperformed Perth from 1986 to 2023. The real story is in the (dotted) exponential regression line below.
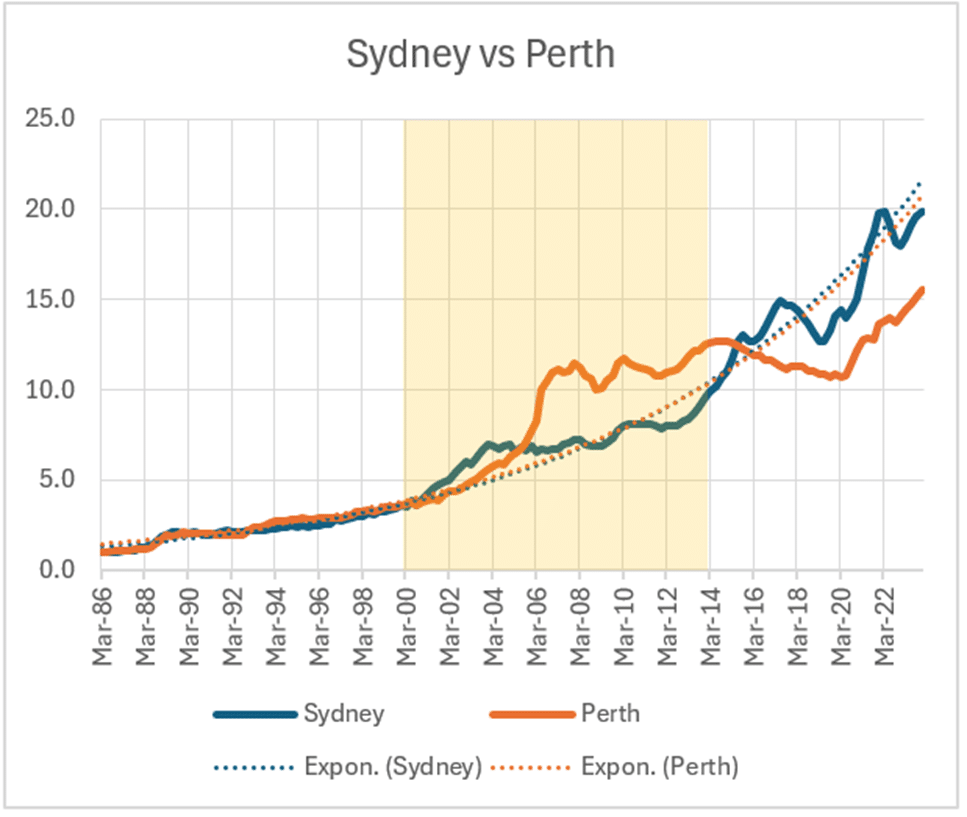
The regression considers every single data point in the series and can be thought of as a fancy trendline or average. We can see that prices see-saw between being above and below the regression line. But they always tend to move back to the line over time… which is why it is called “regression to the mean” and also why real estate is known as a mean reversion asset.
More importantly, the regression lines between Sydney and Perth are almost identical. This implies that the long-term performance of both markets is very similar. Considering that the prices in Perth are currently a long way below their regression line, it means that prices are deeply undervalued compared to Sydney (and every other market in Australia). Over the course of this cycle, we expect prices to move up to and over the regression line before the market cycle is over.
This has been a long post, but suffice it to say that Perth is still looking great, and if I had any borrowing capacity left, that is absolutely where I would be looking.
**Around 70% of personalities are classified as Sensing types on the MBTI indicator. These tend to be focused on daily tasks. Sensing types are better at managing processes that don’t change much and are slower to depart from the status quo. The other 30% are iNtuitive types who are more focused on longer-term goals and are better able to visualize the big-picture changes. These types are the most capable of anticipating and responding to changes.