

Please fill out the details below to receive information on Blue Wealth Events
"*" indicates required fields

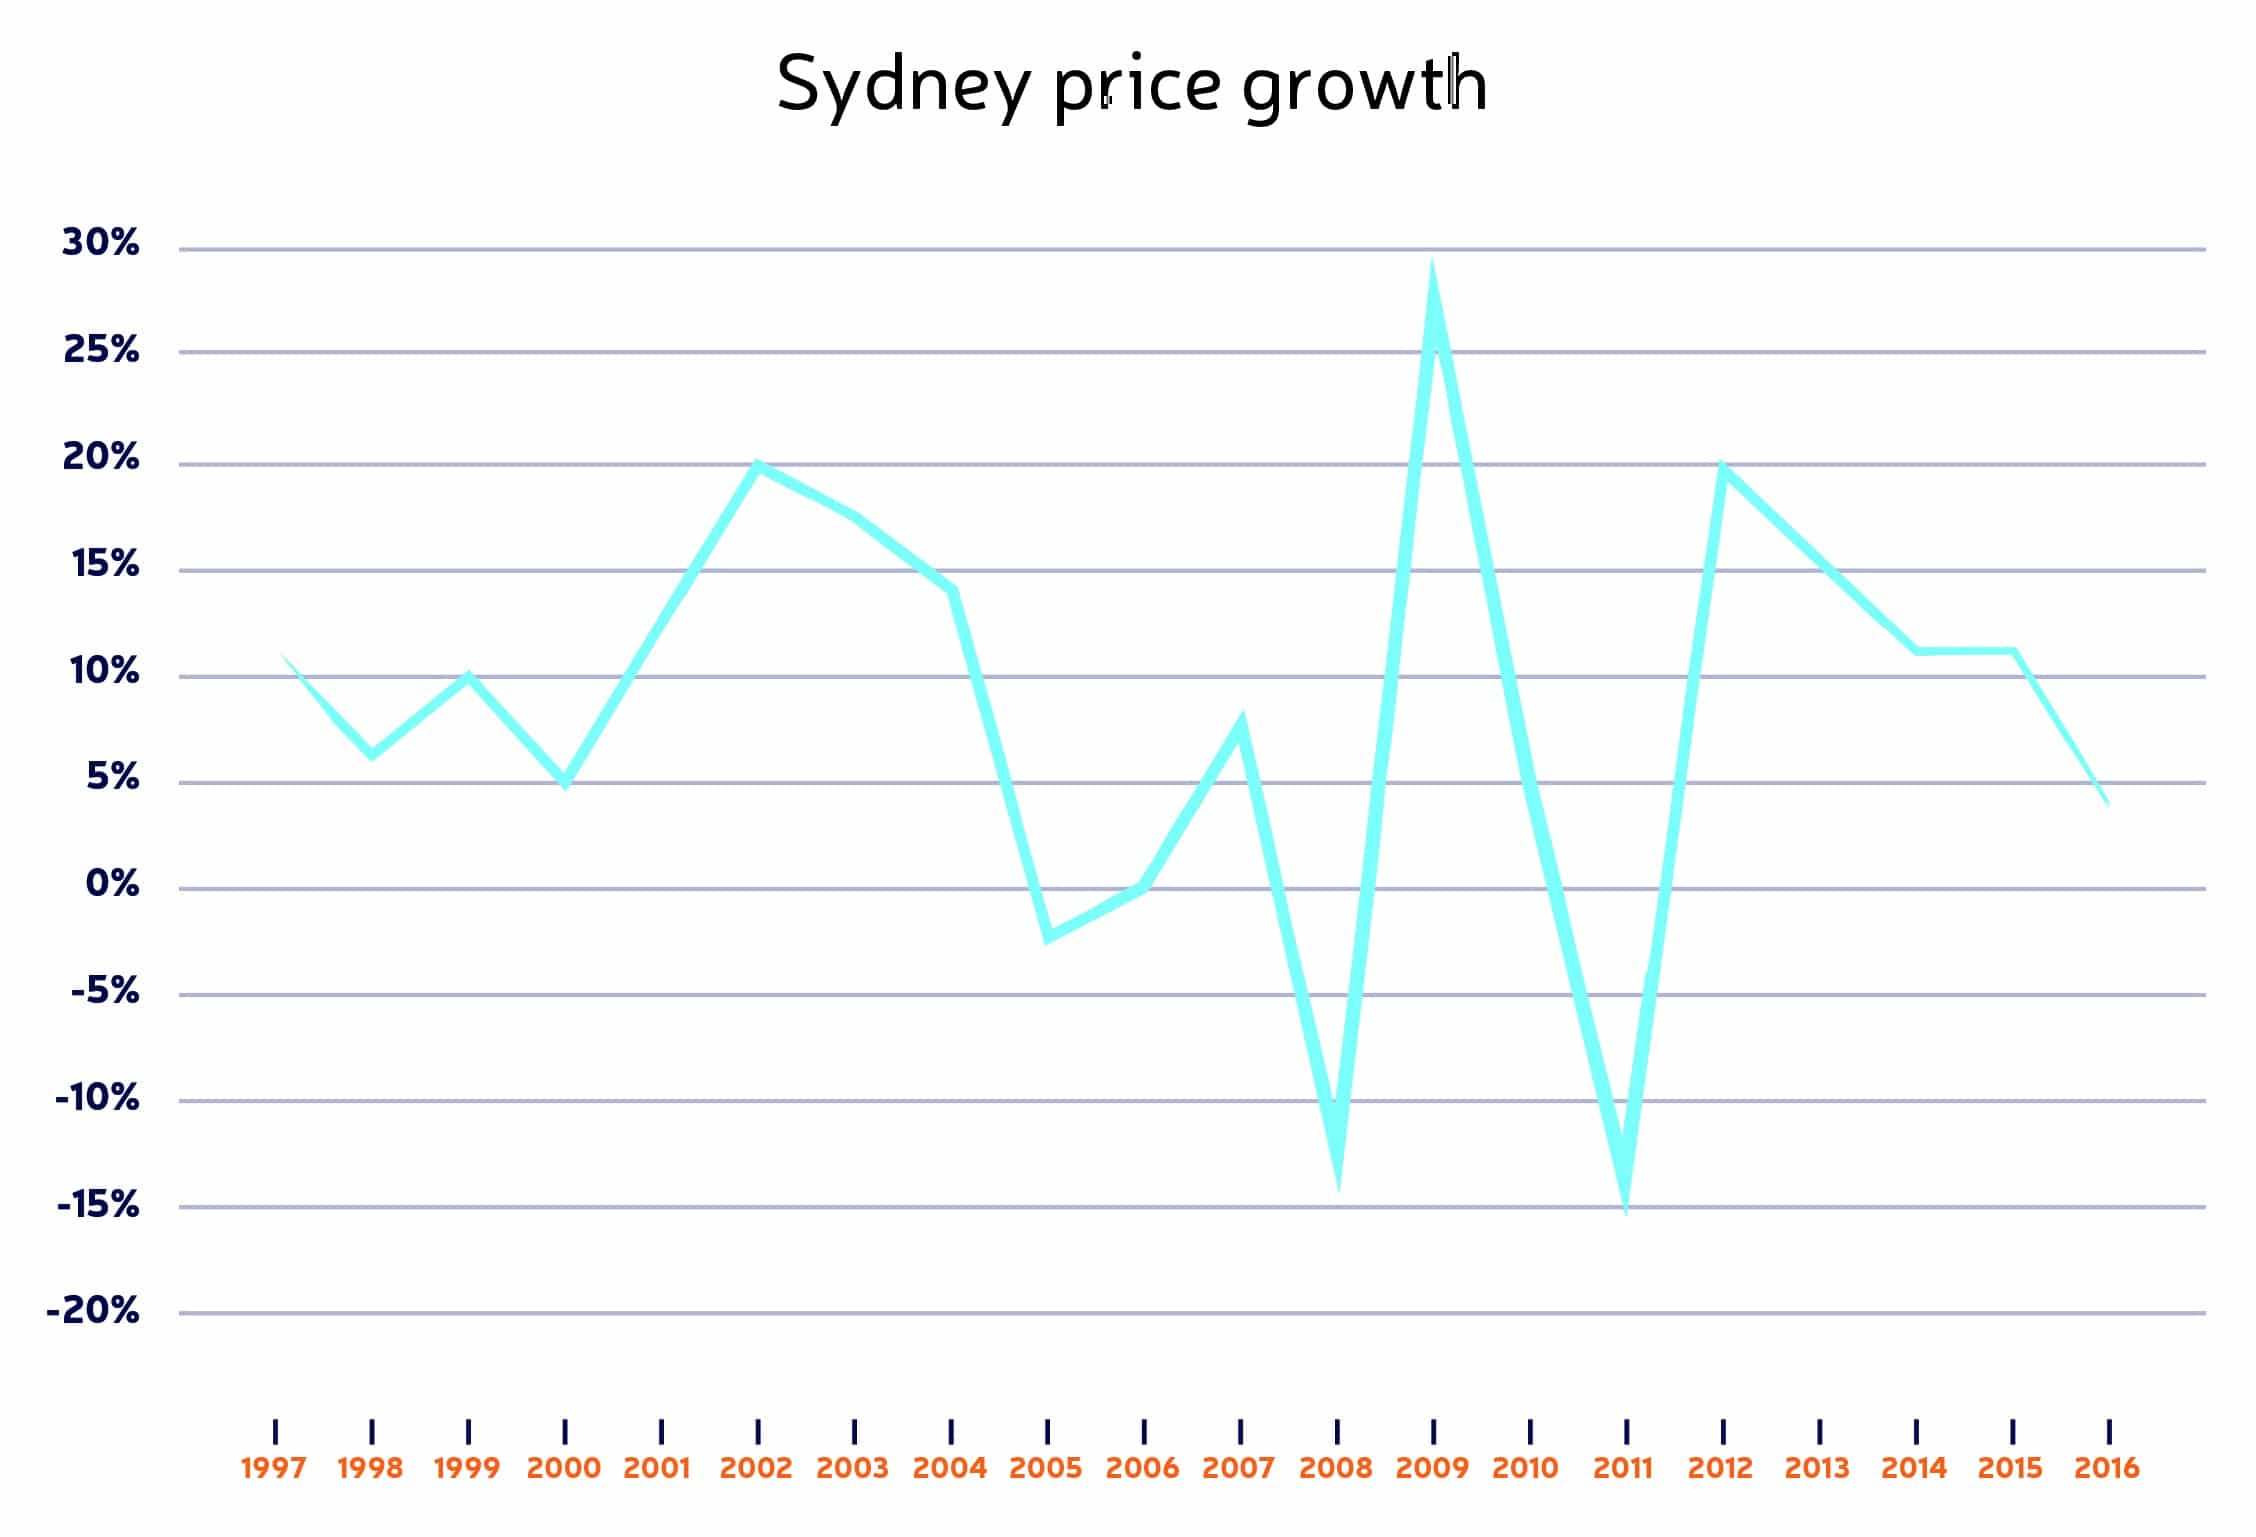
Between 2012 and 2017 the Sydney market experienced growth of 76%. The harbour city is building a reputation for its extended periods of subdued performance followed by exponential growth, the most recent peak being likened to what occurred in previous cycles in 1990 and 2004. Over the last five years median prices surpassed $1 million, a clear indication that the affordability ceiling in Sydney is fast approaching.
Past performance indicates that post-boom periods often led to extended periods of correction. Between 2005 and 2012 the Sydney market remained relatively flat and in some regions experienced falls of up to 13%. In the latter part of 2017 the strain on affordability resulted in a slowdown in demand, and we are likely to see this continue into the medium term as a period of correction or subdued growth.
There were 159 Sydney suburbs with a median house price below $500,000 in 2012. So far in 2018 there are none.
Source: Your Property Investment Magazine (January 2018)
Sydney’s strong performance was largely a result of significant investment in infrastructure, consistently strong population growth and, anecdotally, the ‘fear of missing out’. New South Wales currently leads the way in terms of retail spending, business investment and unemployment, key indicators for market sentiment and confidence. Commsec’s State of States report for the October quarter of 2017 revealed that New South Wales (1.6%) sits third behind Victoria (2.4%) and ACT (1.8%) respectively in terms of annual change in population.
New South Wales maintains its position as one of the top performers with regards to economic indicators, which lowers the likelihood of a significant correction or decline; however, strain on affordability and strong growth in construction commencements is likely to dilute demand. In the June quarter 2017 construction commencements increased by 55% on the previous quarter. Added supply will limit future growth, particularly for the attached dwelling market.
When assessing median incomes as a multiple of median prices, Sydney is the second least affordable city in the world after Hong Kong.
Source: Demographia
As at December 2017 vacancy rates had exceeded 2.5%, a figure that has not been surpassed in over a decade. Previous vacancy spikes have occurred; however, demand tends to react quickly to these peaks, restoring vacancy levels to back below 2%. Because of the strong price growth rental yields have been declining since 2014. The average rental yield achieved for houses in Sydney sits around 2.8%, while for apartments it is around 3.8%. The ability to hold an asset has become difficult in Sydney as income from the property is unlikely to offset the interest repayments.
Outlook for 2018
As experienced in the previous post-boom periods, growth in Sydney is likely to remain moderate or subdued for some time, particularly for the attached dwelling market which is still seeing significant amounts of development. The limiting of future growth and correction of the market have been driven by: